K-Means Clustering
🔔
K-Means Clustering categorizes responses into several groups based on similarity,
without requiring separate classification criteria.
Please select the item you want to classify.
- Only responses to items with short answer, long answer, numerical, and subjective table questions can be analyzed.
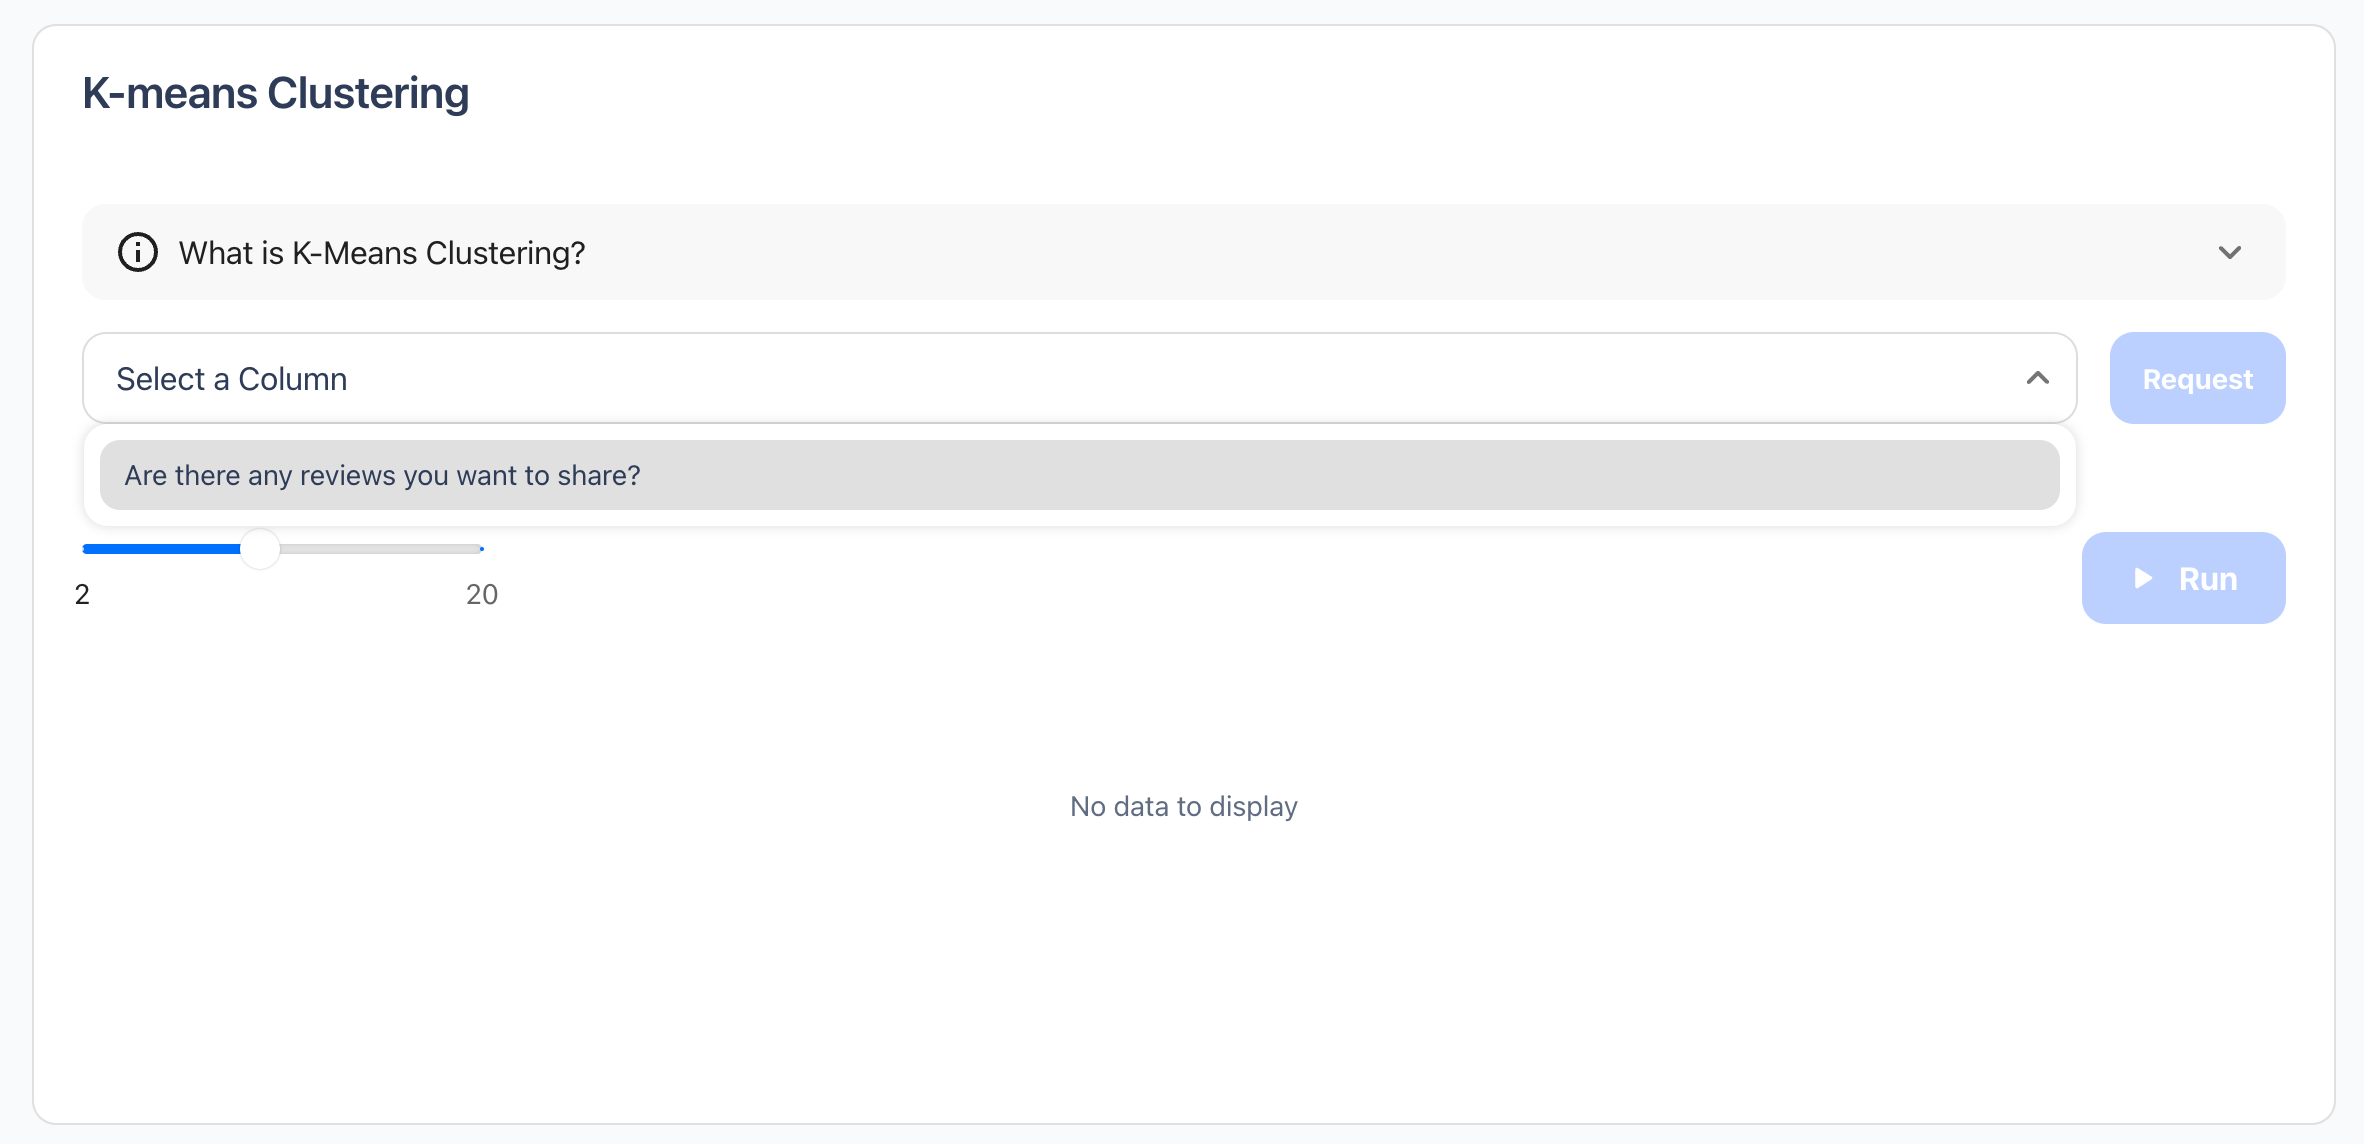
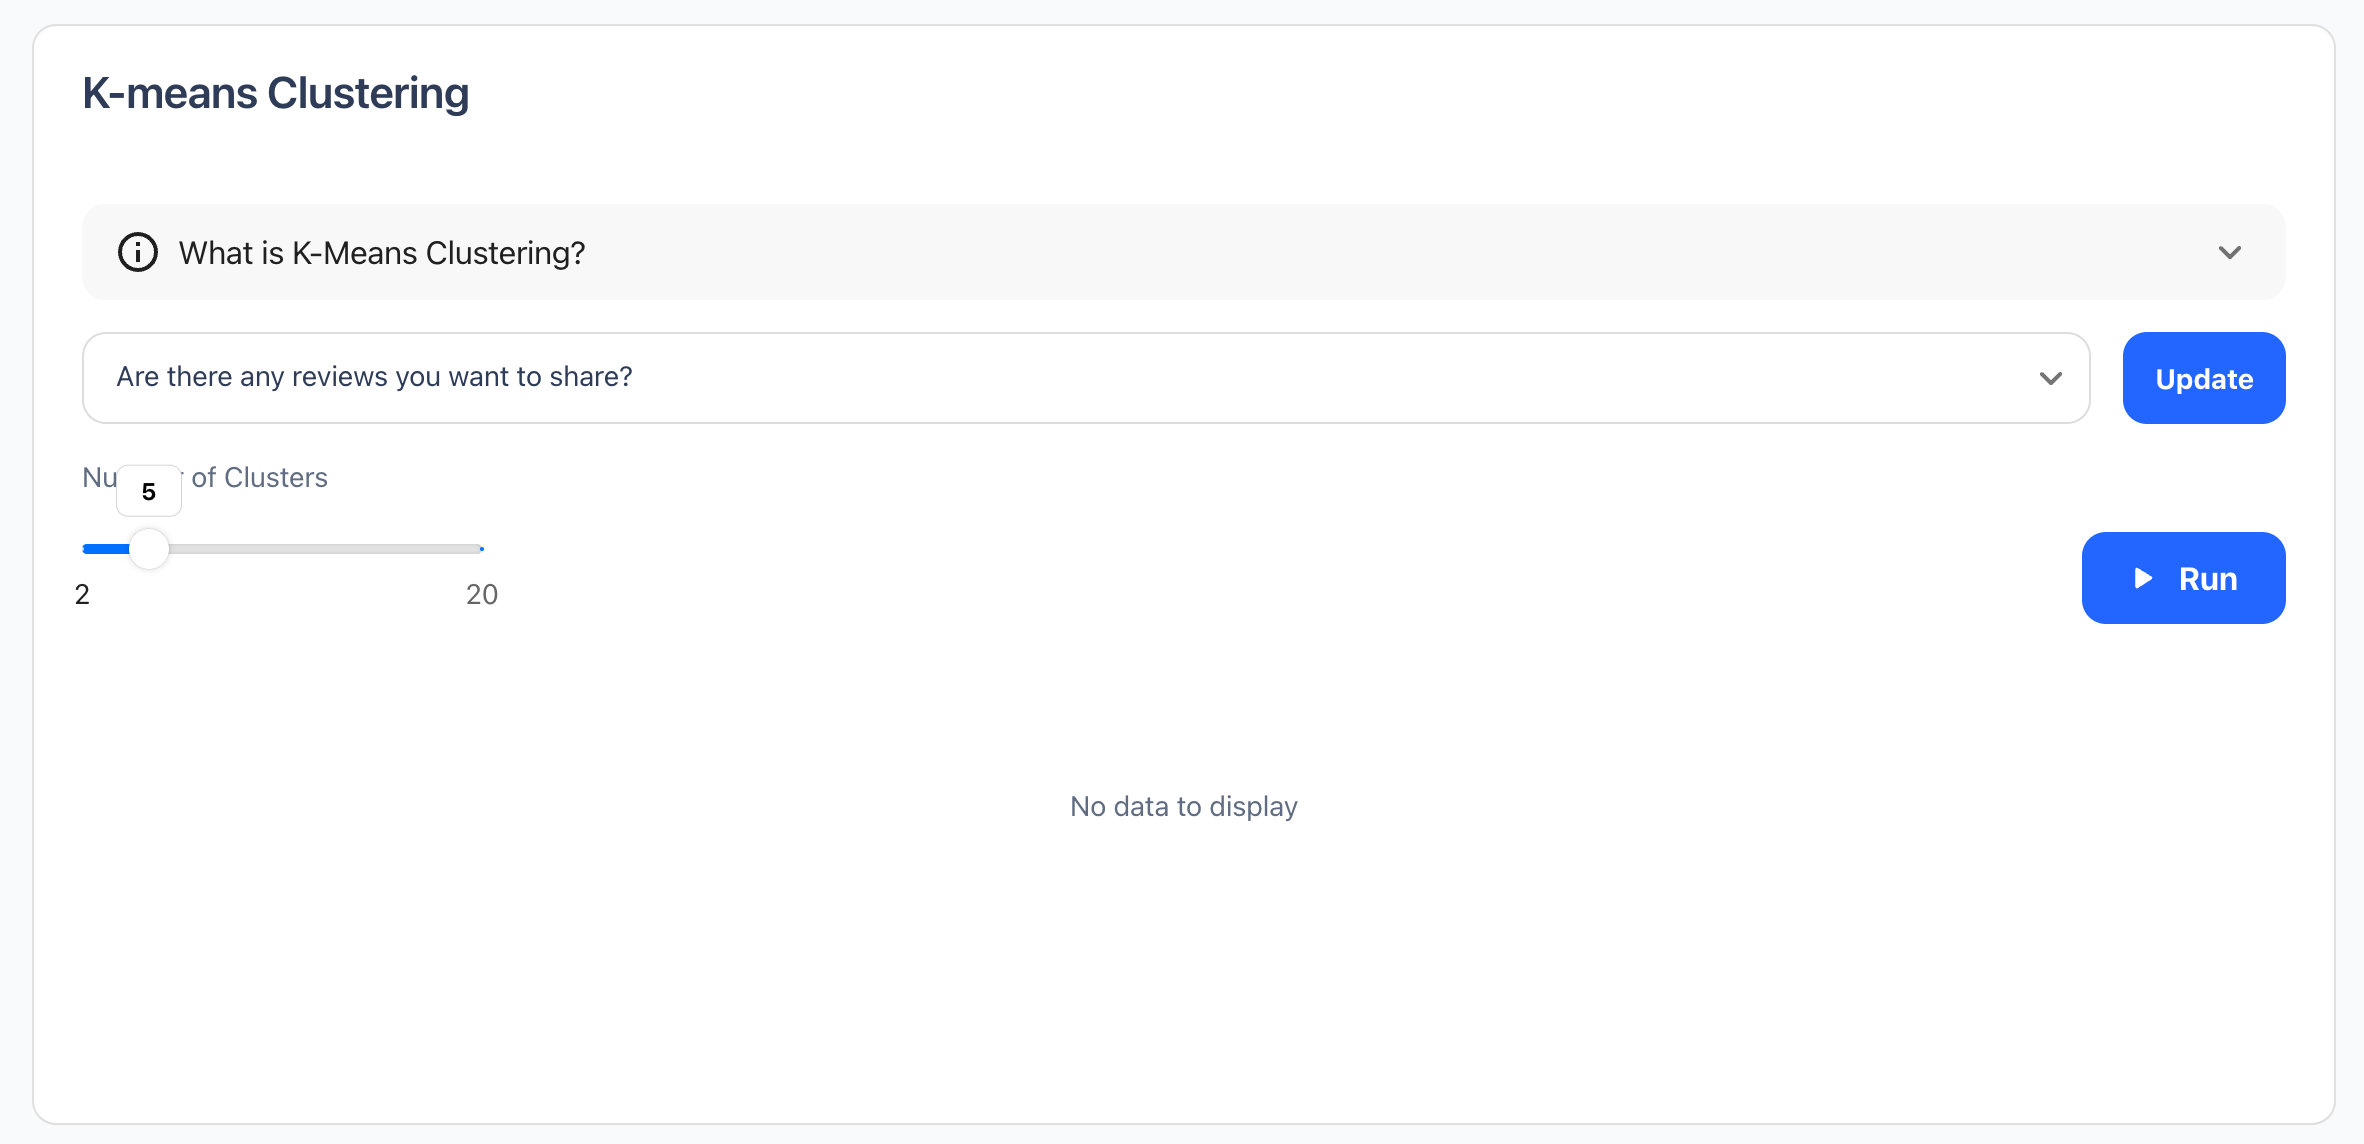
Select how many clusters you want to create.
- You can classify into a minimum of 2 and a maximum of 20 clusters.
You can review the results with a Venn diagram and scatter plot graph.
- The Venn diagram allows you to see the proportion of each response cluster.
- The scatter plot graph enables you to compare the relationship between each response cluster.
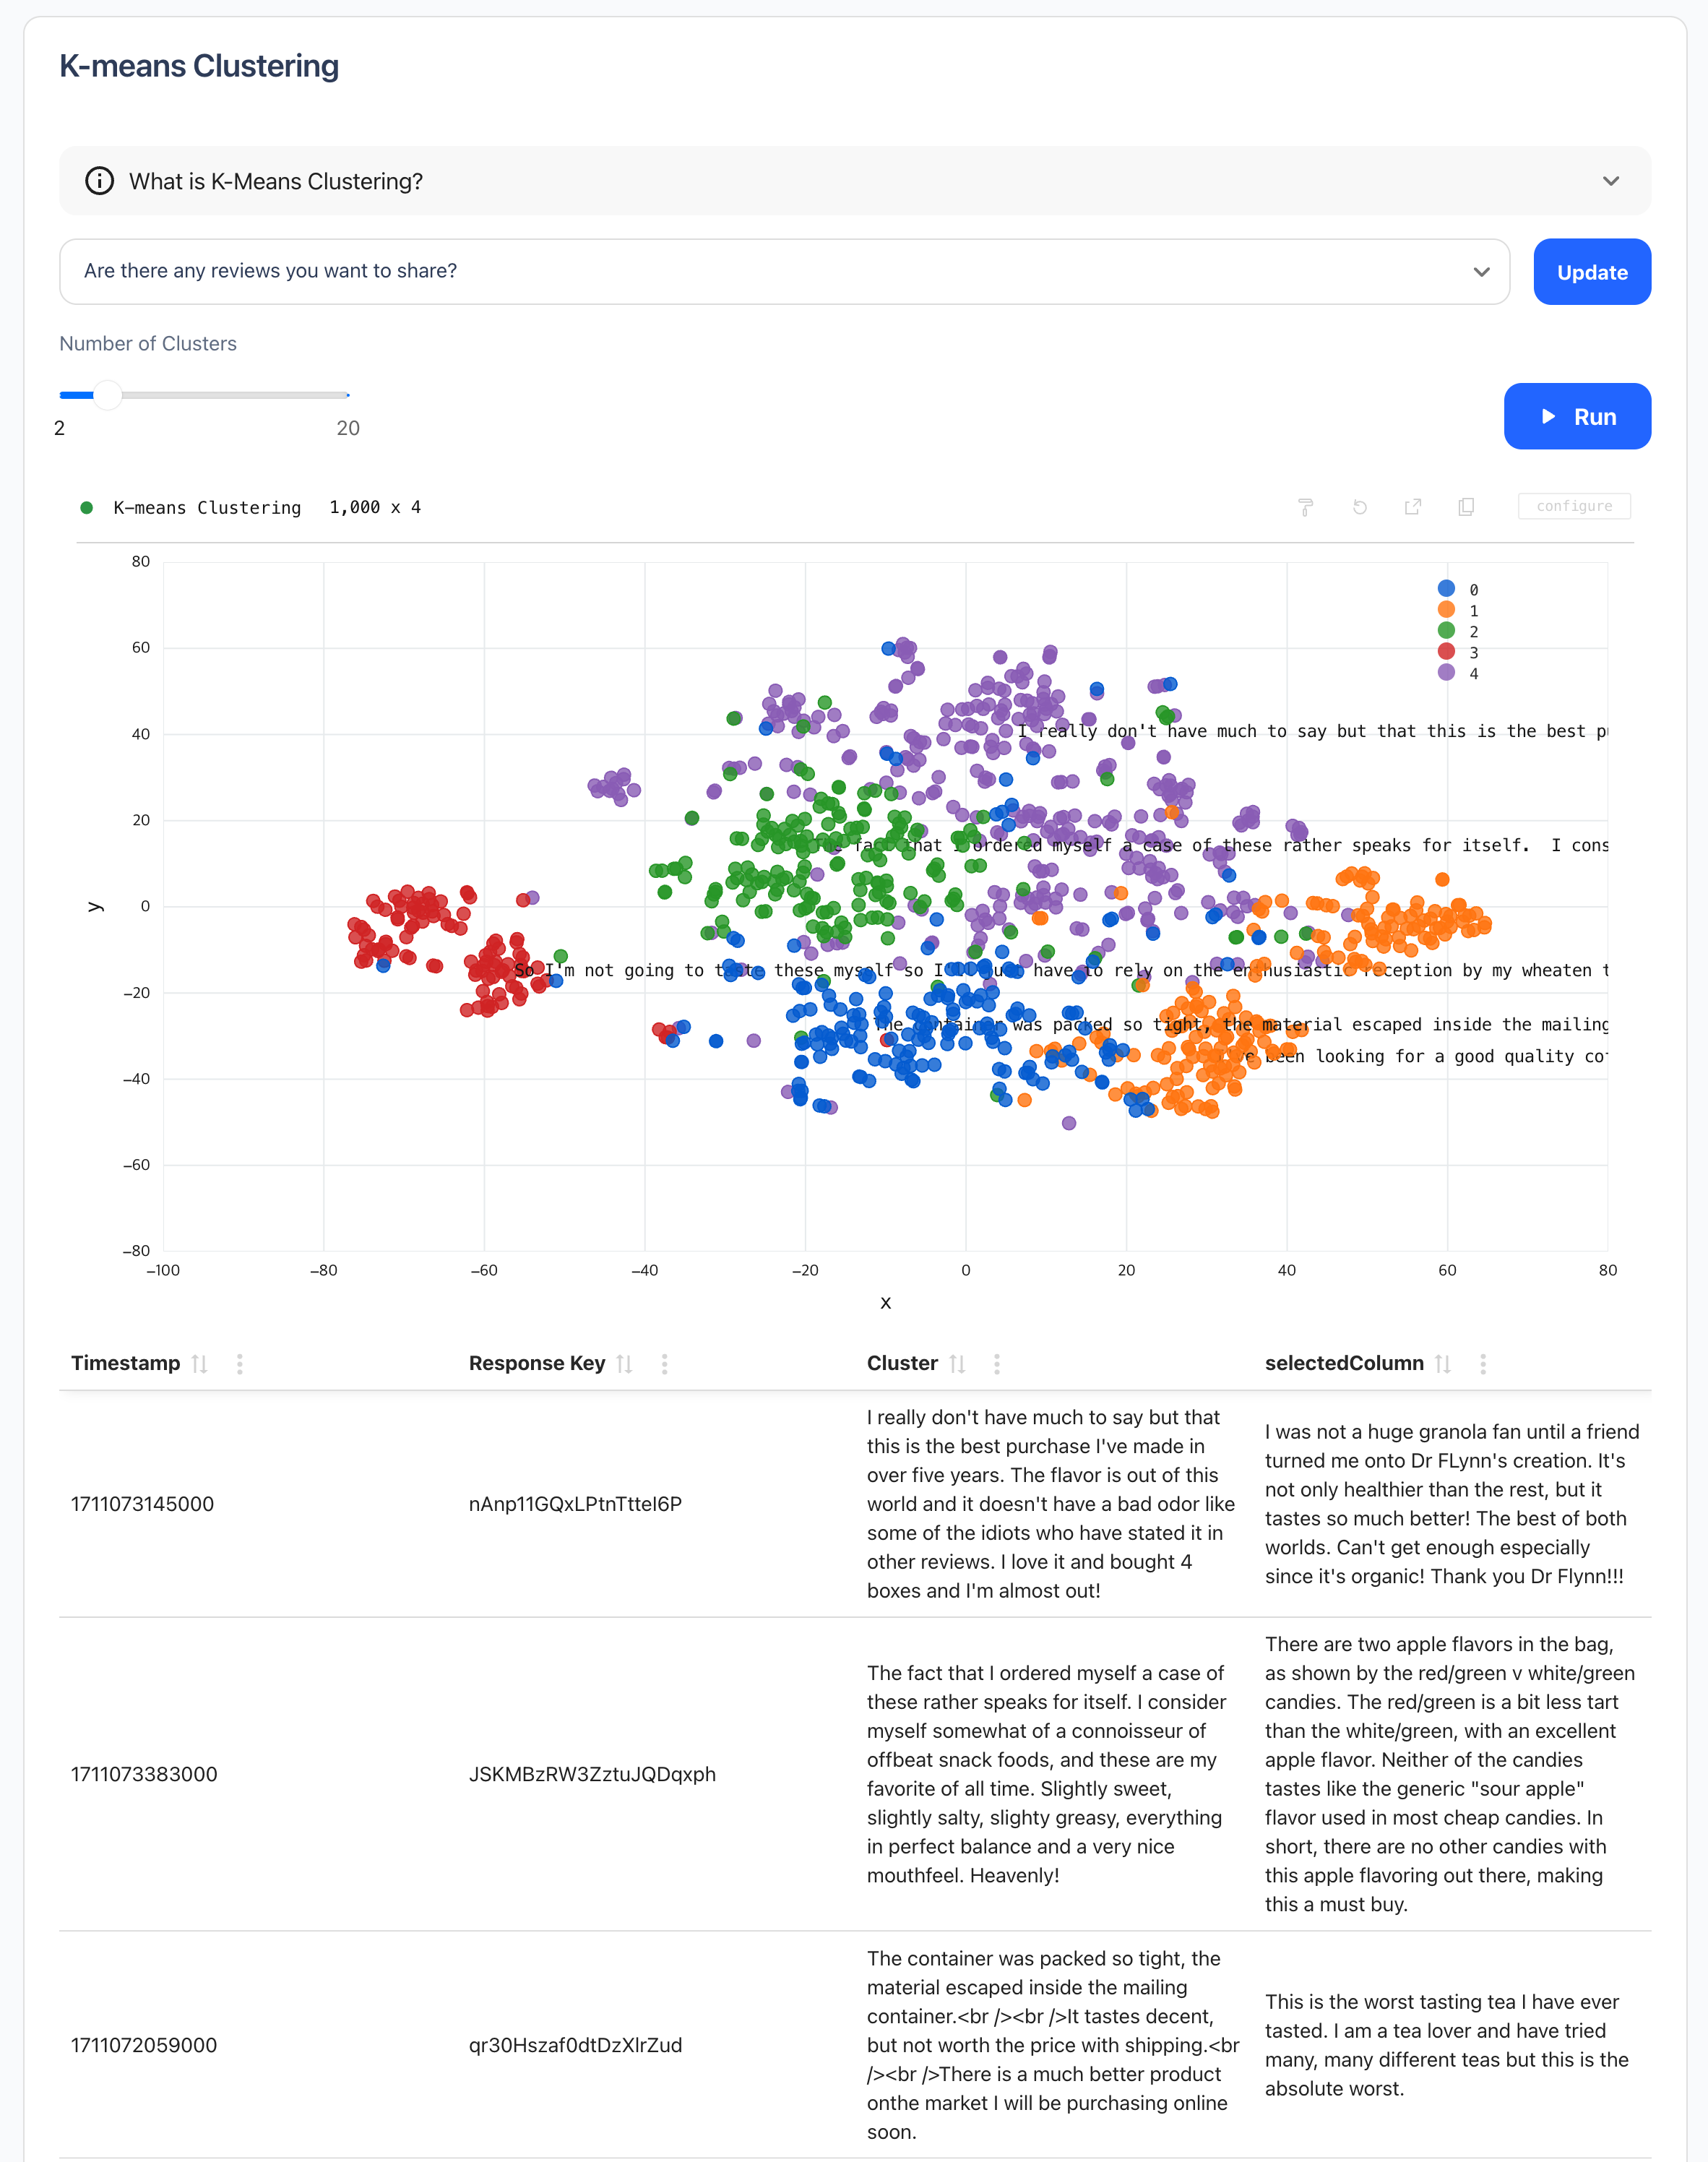
In the subjective response cards on the dashboard, you can primarily review the content and response time of the answers.
🔔
Do you want to check Walla's future development plans or suggest new features?
Click Product
Roadmap and Feature Suggestions